
Performance in web-apps: the objective
Which is the goal in the performance race? Maybe you need to focus on perceived performance instead. Do you know your TTFB? Let's talk about all of it in the second post of the saga: performance in web apps!


You might have heard about SMART objectives, in theory, they seem like a great idea, but usually in practice it is not so simple to define a specific, measurable, achievable, relevant, and time-based goal.
Specially, mobile web-app performance is not the exception to the rule.
Which is the goal in the performance race?
I've already mentioned it: at least 3 seconds, but if that is too hard for you at this moment you have other goals before the last stand.


First of all I will strongly recommend to compare your app with your main competitor for reference.
After that you can check the average times in the industry segment you are.
It is also a good idea to search for expected response times per region.
In this link you can find an interesting analysis (published in 2018) and a little more up to date here.
Let's assume that all of you are now sure about the importance of measuring performance, but maybe you are not sure about what is the thing you want to keep an eye on it.
What are we going to measure?
I want to emphasize something at this point, usually when you listen the "expected time" we are referring about the load time of your web app, but if your goal is to retain your users we are more interested in the perceived performance rather than real performance.
A lot more can be found here, as well as a nice explanation about Jank and why you want to avoid it.
In summary everything is about feedback in the UI, and particularly been perceived as a performant site you want to focus in:
- Time to start rendering
- Time to become interactive
- How smooth is your page scroll

Not all the components in your screen are equally important so you’d probably want to track the one(s) that are called hero components of the view: those are the ones which allow you to perform the main action.

These ideas are very tight to UX and also made us able to compare performance across pages and despite the technology we are using. Usually you want to track the time it takes to become interactive from your hero component and you want to check how long it takes since the rendering started until the user can successfully interact with it.
Always remember that, while the component is present but the user can not interact with it, you are providing a terrible experience, such as: a button that seems to be NOT working, a selector that is broken leading to a site that is NOT working at all.
How does the web really work?

First of all we need to find the server who is the destinatination of our request, in order to achieve that a DNS Lookup takes place (you can read more about it here). After that we know where (which IP) the request needs to be sent.
When the server receives the request it will process it and generate a response. Be aware of the SSL Negotiation that (hopefully) would happen, you can read more about it here.

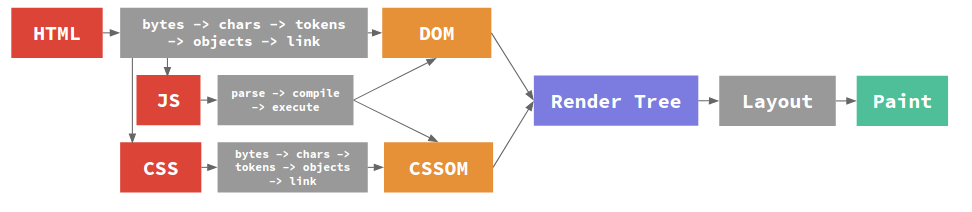
Let’s assume that everything is very simple and we ended up with an HTML response as the result of our innocent request, then the browser needs to show you that html, and in order to do that it is going to parse and create the needed Render Tree and be able to start painting:
At this point you might be wondering why I am explaining all of that. The reason is that all the solutions focus in decreasing the time it takes to follow this path, so the first step is to understand what you are measuring. And then you need to choose solutions that are a good fit with you own site.
Always remember there is no silver bullet
So… the metrics are
I’ve started this section promising to clarify what you want to measure, and so far I have explained a lot of stuff but not that part, so here I leave a summary of my personal selection plus a brief explanation:
- Hero element available: The moment when your hero is available at the screen.
- Time to interactivity: the moment when something (I strongly recommend your hero element but it can be even the full page) becomes interactive.
- Server delay or Time to first byte, formerly known as TTFB: how long it takes since you make a request until you receive the first byte of the response.
- Number of requests: the number of requests you need to perform to show your view
- Start rendering: the moment when the first visual component starts appearing in your browser.
- Page size: the weight of your site. I must recognize that this is a tricky one because your app has many sizes such as the weight in bytes of the html, css, javascript, images.
- Page Load: The total amount of time it took to load your web-page.
I have ordered the metrics in my own scale of priorities, and for sure you have many more metrics to monitor like scripting time, cpu usage, some industry created indicators such as lighthouse scoring or speed index and a lot more.
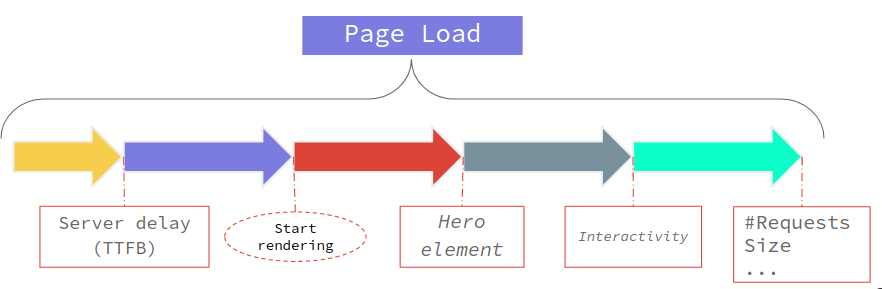
To clarify a little more the expected path of appearance of the metrics, if you assume that you have made a request and you end up with the full content displayed by the browser, it would look like this:
In addition, if you want to keep reading about performance, UX, metrics and a lot more I can't highlight enough the doc that Google wrote, specially this part.
Do I need to manually test all of this?
The answer is HELL NO! But this post is long enough and I promise that the next one will be entirely focused in naming and talking about the available tools that allow us to fulfill the task.