
Performance in web-apps: the results
Now that we know the tools to measure our web page performance, what do we have to look at? What do all these numbers mean? Fear no more! Let's take a look!


As I have already mentioned before, sadly, there is NO silver bullet and you will need to take your time in getting to know your app deeply: understand how it is composed, where is it taking "the time" to process, which are your hero components, drink some coffee/tea/mate or whichever you drink for relax while you revise the waterfall and connection usages.
If you have questions like which tool shall I use? or What am I supposed to measure at all? I recommend you the previous posts about performance in web-apps (specially, the tools and the objective).
Show me what you’ve got
I will show you some interesting reports I've found, why I believe that they are interesting and how they've helped me to get in touch with my apps.
Overall results
The following are screenshots from webpagetest results for 10pines.com site.
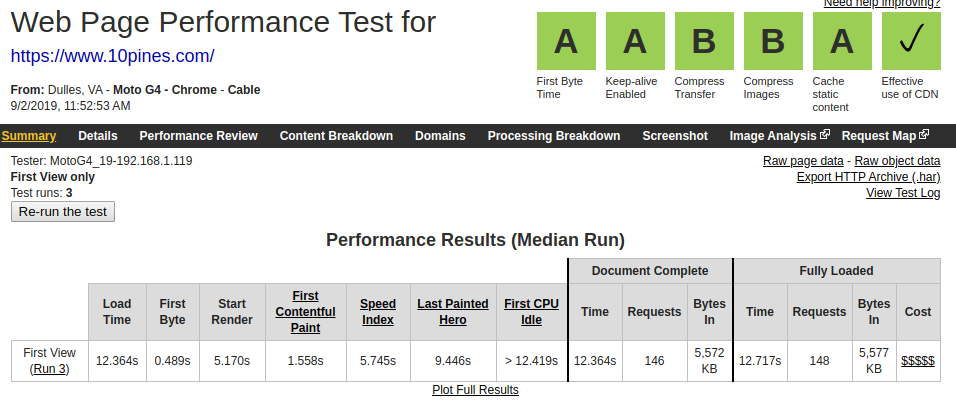
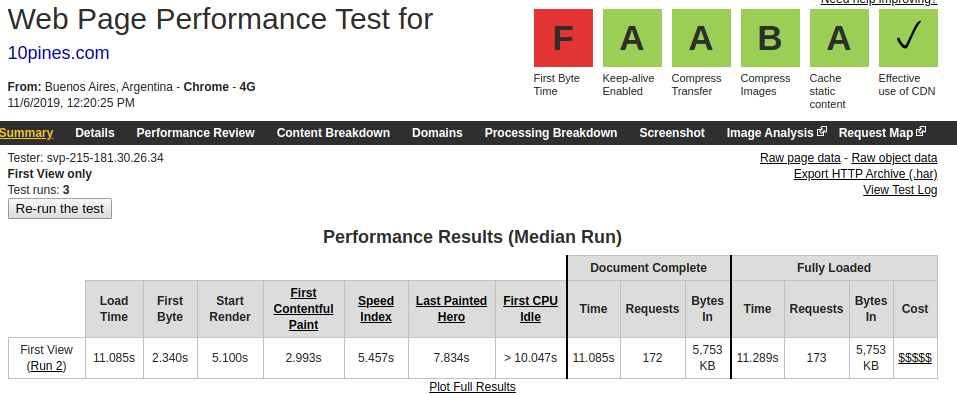
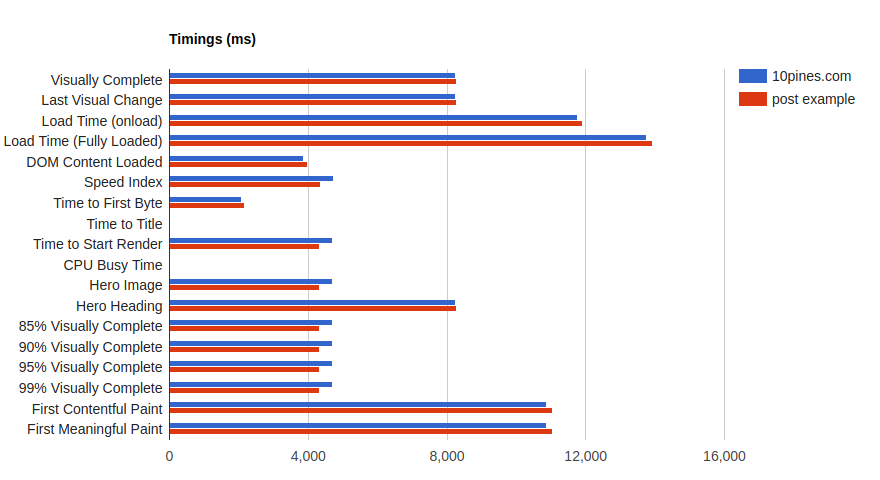
Do you remember what I mentioned about regions and connections? (If you don't, I recommend the previous post: the objective). Well, take a look at this result and see how the TTFB got increased for almost 2 seconds after running the test to the same site and different devices, regions and connections:
In the previous screenshot you can get an overall knowledge of the web behaviour to start to understand the current situation:
- Our load time is up to 10 seconds (very far away from the suggested 3 seconds).
- We start to show the web after 5 seconds (on mobile networks), that for our region/standard is OK.
- The TTFB is not good, we could investigate a little more on it but some regions are taking too much time to come back. We probably should revise our architecture.
- The compression of the images is another thing to keep in mind.

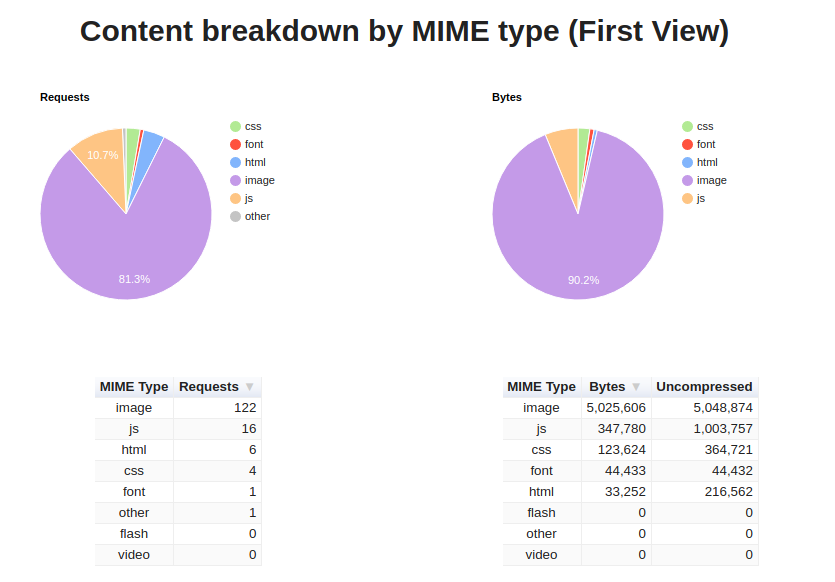
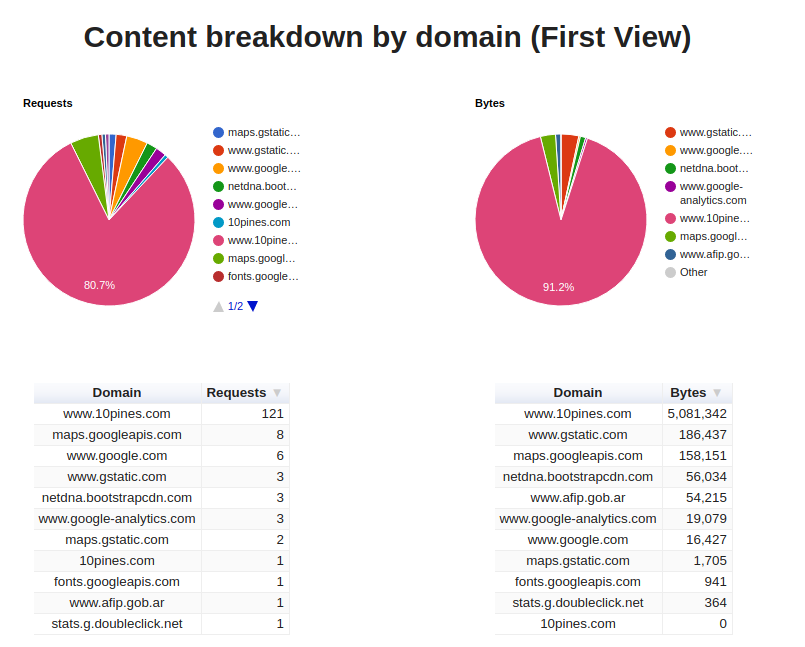
Site composition
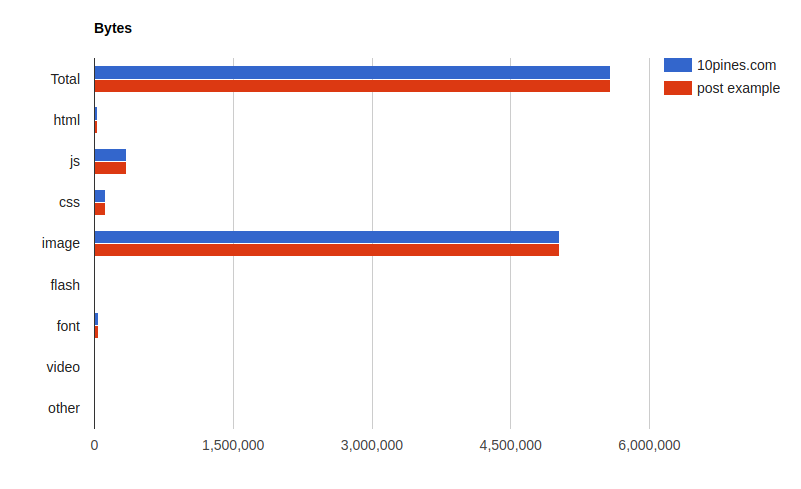
Luckily for us we have: tools to the rescue! (again). And many of them can show us the composition of the response after being fully loaded.
Following with 10pines.com, we can see that our app is almost pure images, so the biggest opportunities, for improving the site performance, should be related to that.
Please notice that the compressed/uncompressed bytes are exactly the same. Right, so we should compress the images since we are not doing it:
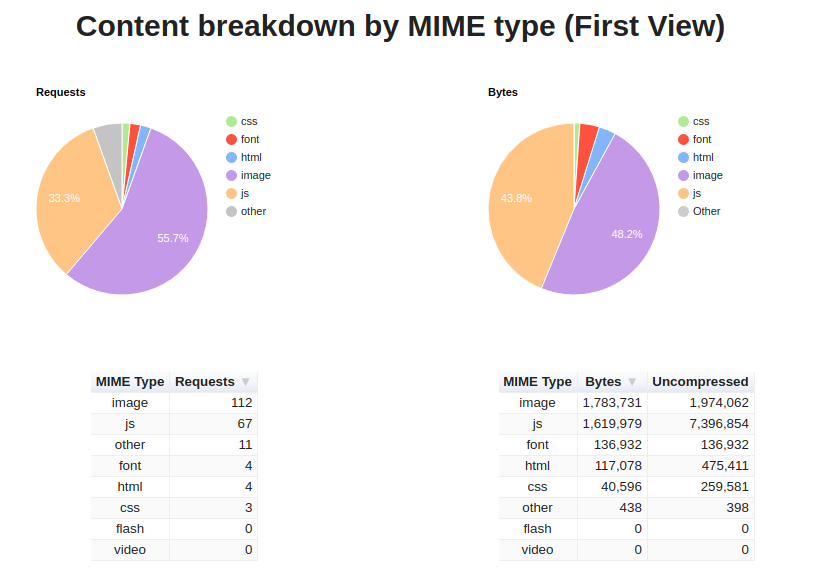
Be aware that each app has its own (and very different) result This is an example of another site where we can see that we are receiving a lot of (compressed: Good!) javascript.
Probably if this was my app I would keep an eye on solutions that allow me to send less javascript to the client:
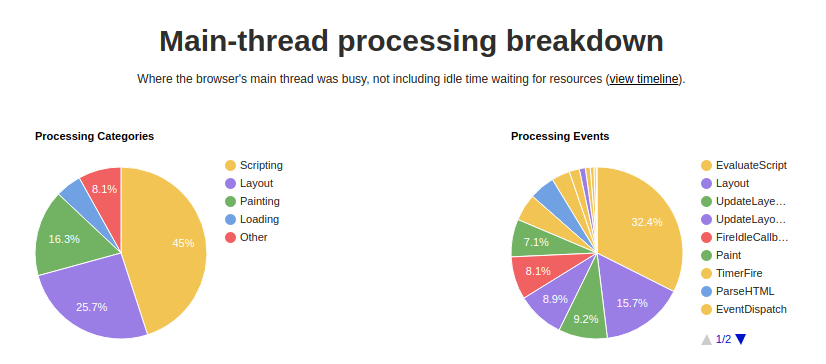
Specially because if I look at the processing breakdown:
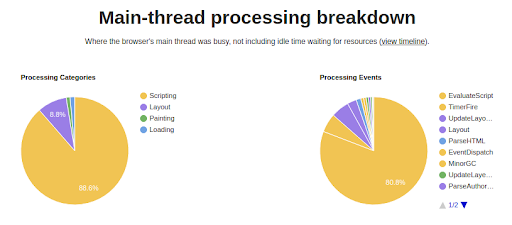
It's really noticeable all the time the browser is using in order to process that javascript.
If I compare it with 10pines.com, they have very little in common:
I hope that I have already convinced you about the importance of a deeper understanding in your site composition.
Since the site that I have chosen as my example (10pines.com) has interesting results following the path of the images I will continue with that one.
Images
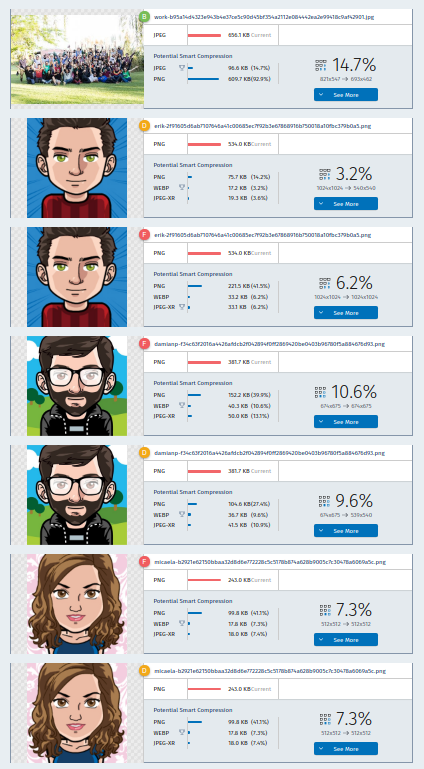
In the previous result I've mentioned that it looks like one big pain in our web are images. Going deeper with the analysis, I can use even more tools to understand my current situation:
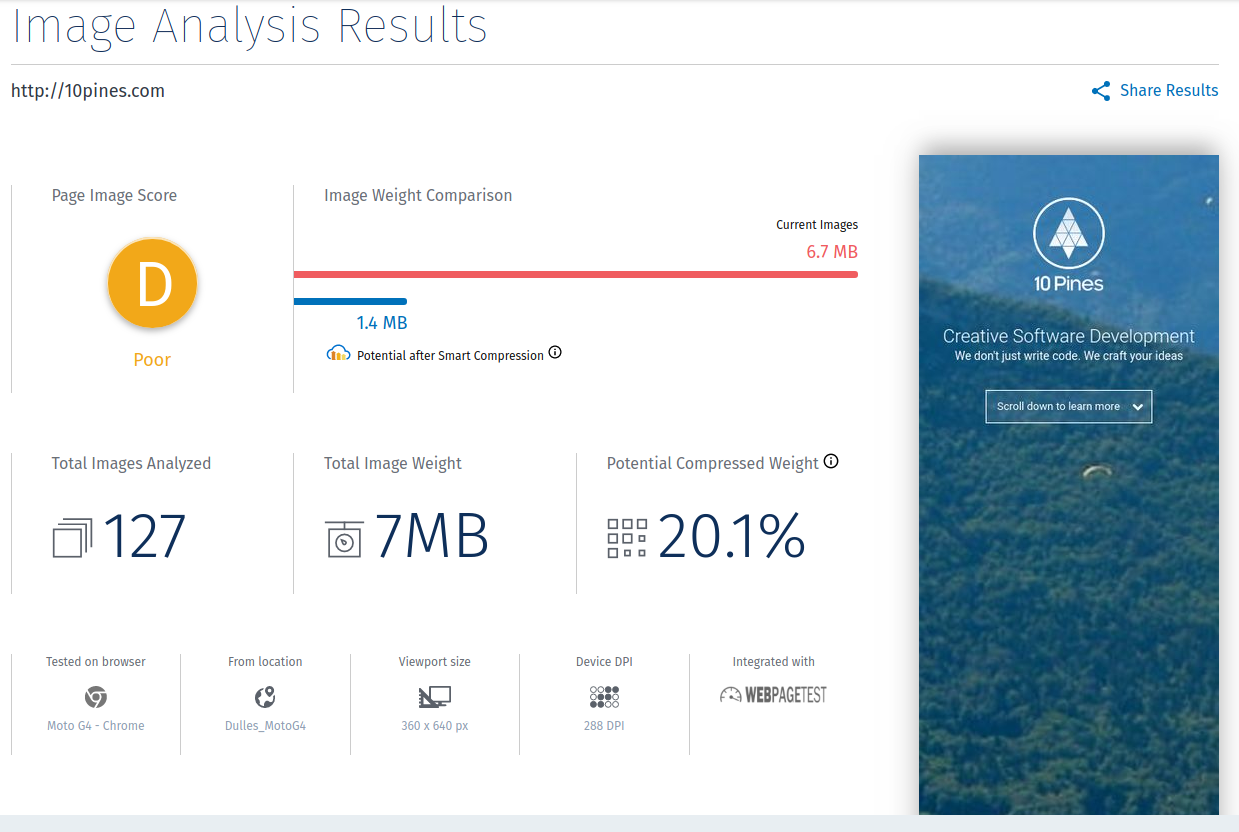
Also at this page (https://webspeedtest.cloudinary.com/) I can see the top potential saving from the page:

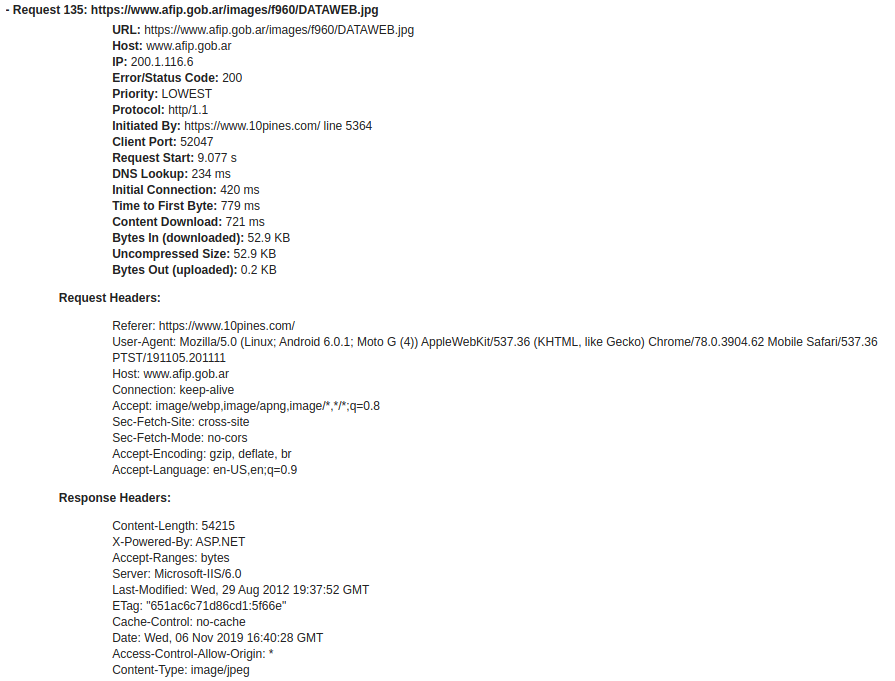
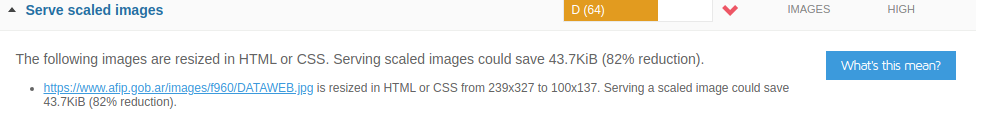
Fun fact, if you are from Argentina you would probably find this result funny:

So, if someone reading this post works for the AFIP might be interested, since it is a legal requirement to add this image and it is really big for the needs we have in the site.
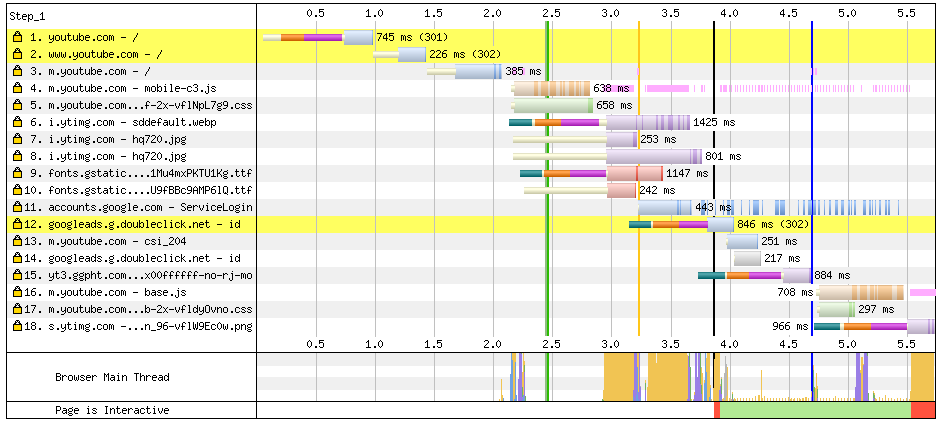
Waterfall
I am convinced that the most interesting findings came back after analysing the waterfall plus the connection usages, because there you can see blocked requests, long times and absolutely all the requests your app is performing:
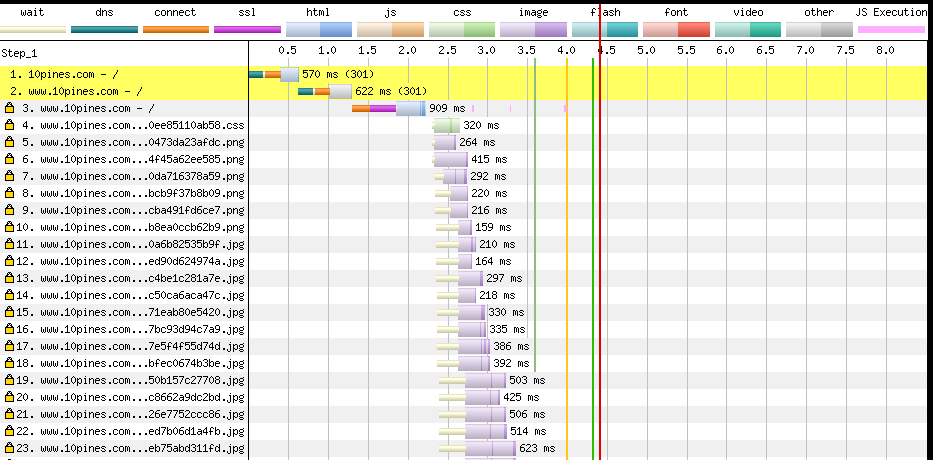
Here our problems with big images are even more visual. In fact, you can see each request and review the result. If a request fails (the return code is not 200) you will see it highlighted with a red background.
Here is an example of a request we are doing to an external domain from 10pines.com (Remember the Image from AFIP?):
And here is the summary of what had happened during the page load, and when our page was or was not supposed to be interactive:

Domains
Moving one step further to understand your performance we shall never forget about the dependencies.
I love to inspect the relationships with my third parties. This is specially important if you rely on others, for instance, if you have adds on your site. Sadly, it is a recurrent situation seeing an add is the responsible of blocking the main-thread and, as a consequence, degrade your site.
I would suggest that you need to audit your third parties periodically (even automatically) to avoid nasty surprises.
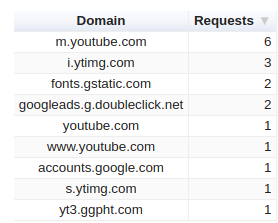
Also, when I am wearing my tinfoil hat I like to run tests against webs I frequently use and take a look at the domain breakdown overview. You can probably see all the metrics/information they want from you.

For instance, in YouTube we confirm the relationship with Google’s product and we can see the dependency with google adds:

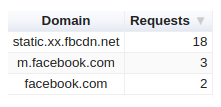
And now you are sure that at least in the Facebook login page they are not tracking with analytics:
Recommendations
Almost every tool adds to the result a suite of suggestions that you need to follow, according to its own criteria, to improve your performance.
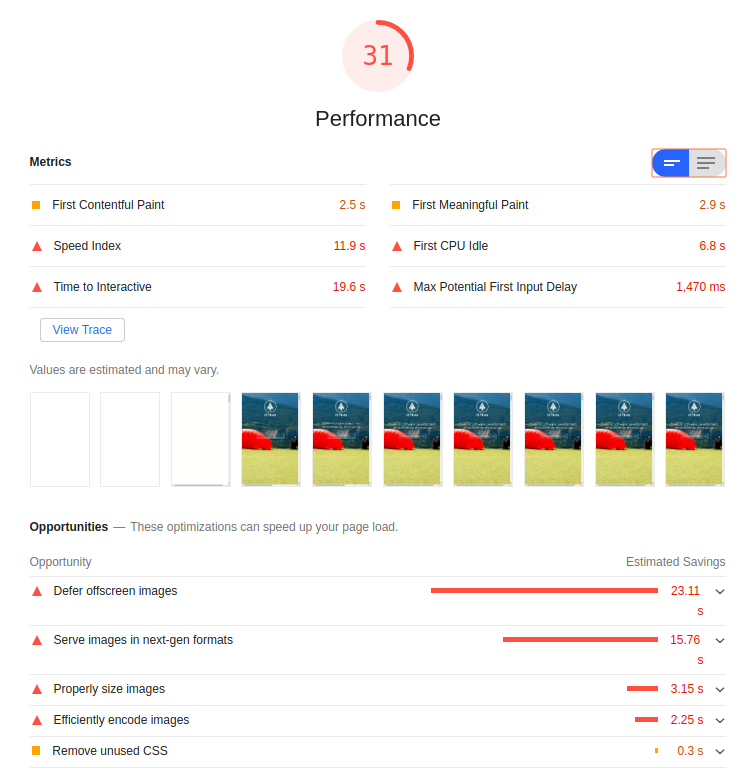
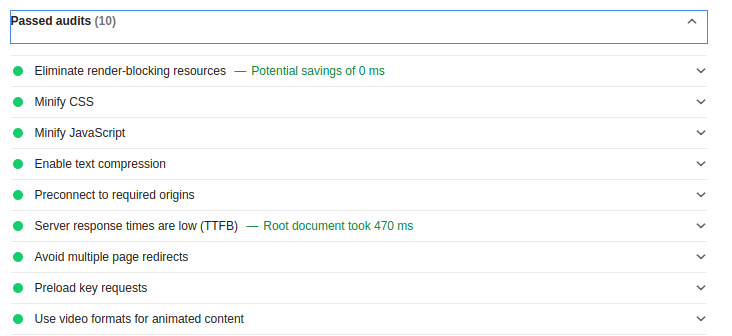
I have already mentioned this but my favourite (because of the way it presents the information) is Lighthouse:

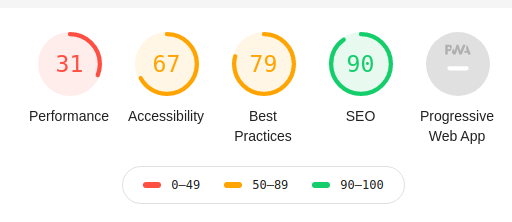
You can even see an explanation about what each measure means and also why that is an important suggestion.

Please do not focus only in the opportunities, it is also important to review what you are doing well:
Here's the example from https://gtmetrix.com after the evaluation. I like this tool because it stresses punctually which is the asset that would get the benefits after the suggestion.
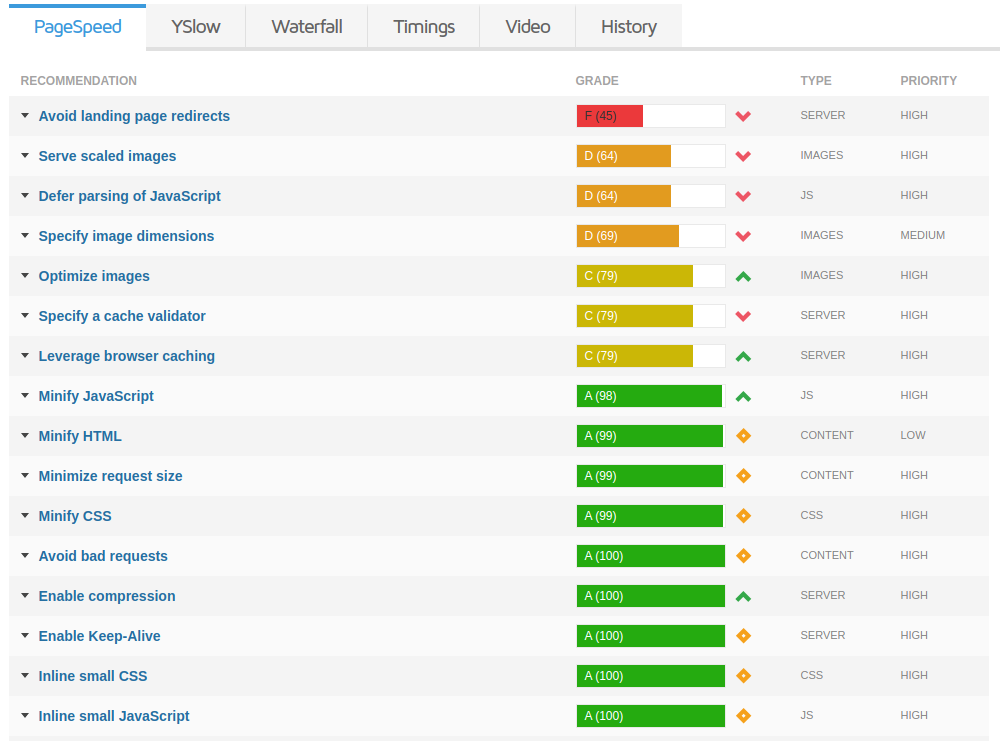
For instance:
Also equally important, all of these are automated tools and what they suggest might not be applicable for you. You are the only one with a real criteria to decide what it is worth to be done and in which order.
Just to give you an example, I can not change the fact that the image from my third party is out of scale and it doesn't really matter how strong it is suggested. For sure at 10pines site it is not really relevant to improve a small image in the footer (that probably none of you have ever notice before this post). However, we could compress all other images and provide versions for mobile/desktop or use progressive image loading for the team section.
Comparison
The whole point of the analysis is to improve your performance, but you will never finish this race because this is a marathon (and it never ends, sorry for that).
Anyway, you have to be capable of understanding your situation and monitor the evolution, with a great tool you could have history in your metrics:
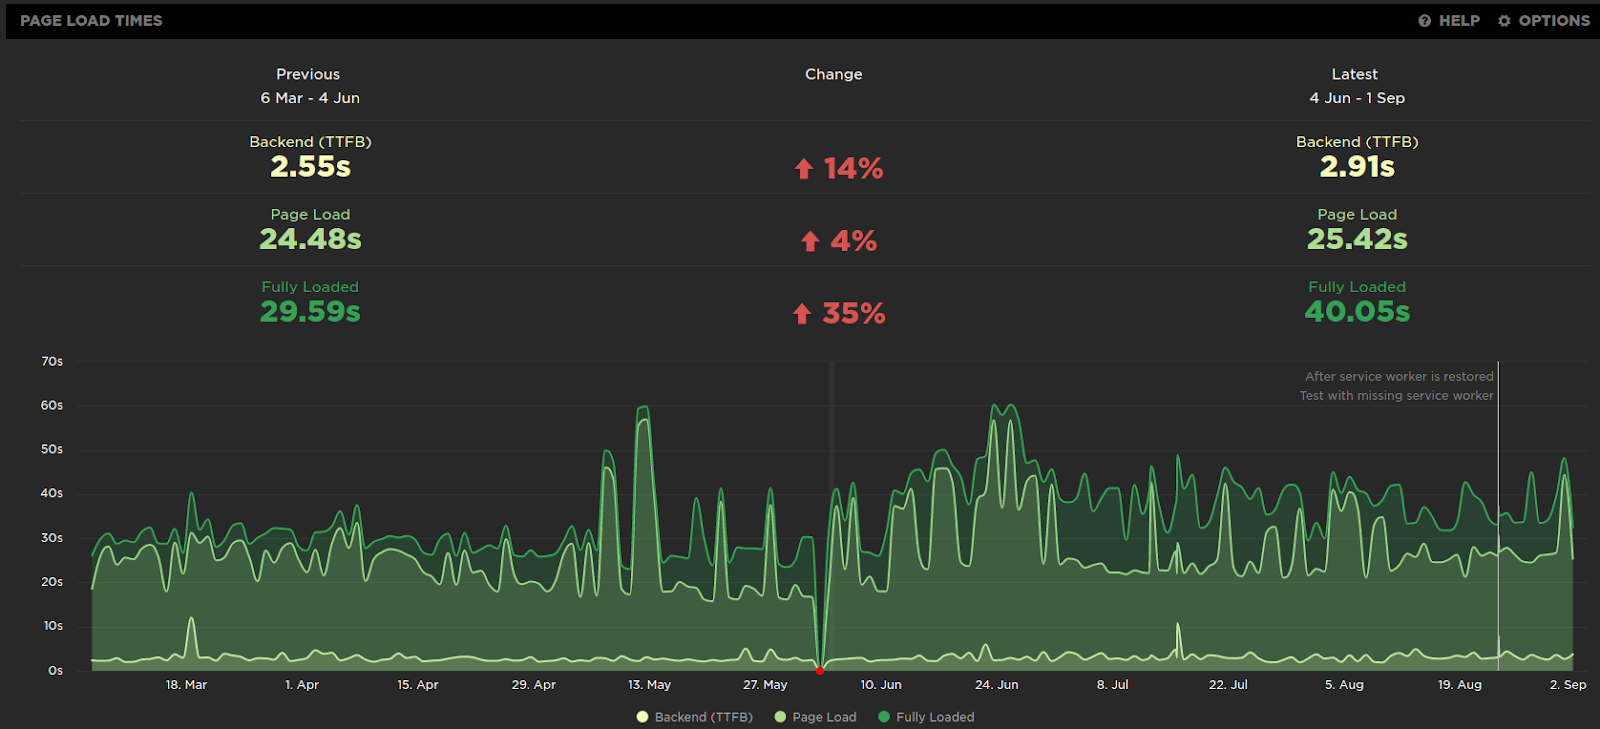
And not only to mark in the calendar that in June the tool was off, it is also useful to find tendencies, run experiments and correct as fast as possible.
Comparing many executions
A tip here, you can compare the behavior between different runs (in webpagetest) and you will see the contrast. Here is an example between mobile/desktop:

To do this in webpagetest you can append the results of the tests with colons to obtain the result. Let’s assume that these two examples are valid urls (at the moment of writing this post they were):
- https://www.webpagetest.org/result/191106_HD_93bd698fea0c49c5d4c7a13cbda2578b/ and a valid filmstrip is: https://www.webpagetest.org/video/compare.php?tests=191106_HD_93bd698fea0c49c5d4c7a13cbda2578b-r:1-c:0
- Another result https://www.webpagetest.org/result/191106_9H_cc197869ba2b4f499183b2816495c04b/
Then, we can create a new url to obtain a comparison of both results appending the second result test "id" with the first result:
You will see among the film strip:
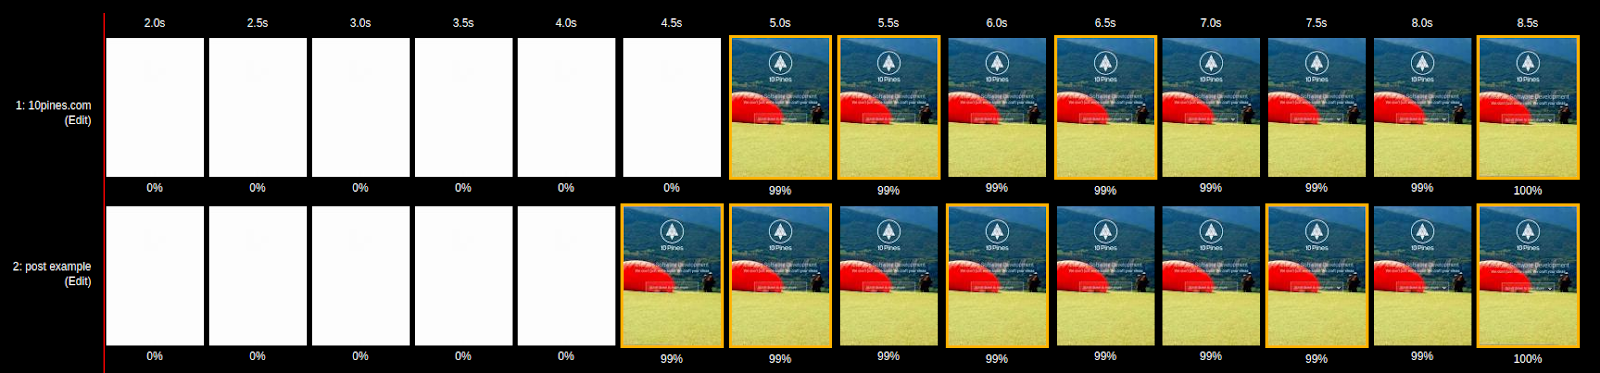
The comparisons between the two executions.You can even overlap the waterfalls processing request of the two page loads.
I hope this post helps you to start analysing your own results! I have basically showed almost every screenshot using webpagetest, but take a look at the results that others tools have ready for you.
In the next (and finally last!) post of this saga we are going to talk about techniques we can use to, actually, improve the web page performance now that we can recognize which are our pain points.
Just started reading this series? You might have missed:
- Preformance in web-apps: the basic
- Performance in web-apps: the objective
- Performance in web-apps: the tools